What is Climate?
Climate is, in essence, the expected weather of a place. Are the summers hot and humid? How cold is the winter? Does most of the rain fall in one portion of the year?
A climatology is an analysis of past data, over a long period of time, in order to describe the patterns. Here I will show a climatology analysis for the weather of Maryland. The data is from NOAA, the National Oceanic and Atmospheric Administration. I downloaded monthly mean (average) temperature and precipitation (rain and snowfall) from 1895 to 2025. Below I show the data over time, each month in order, before more analysis.
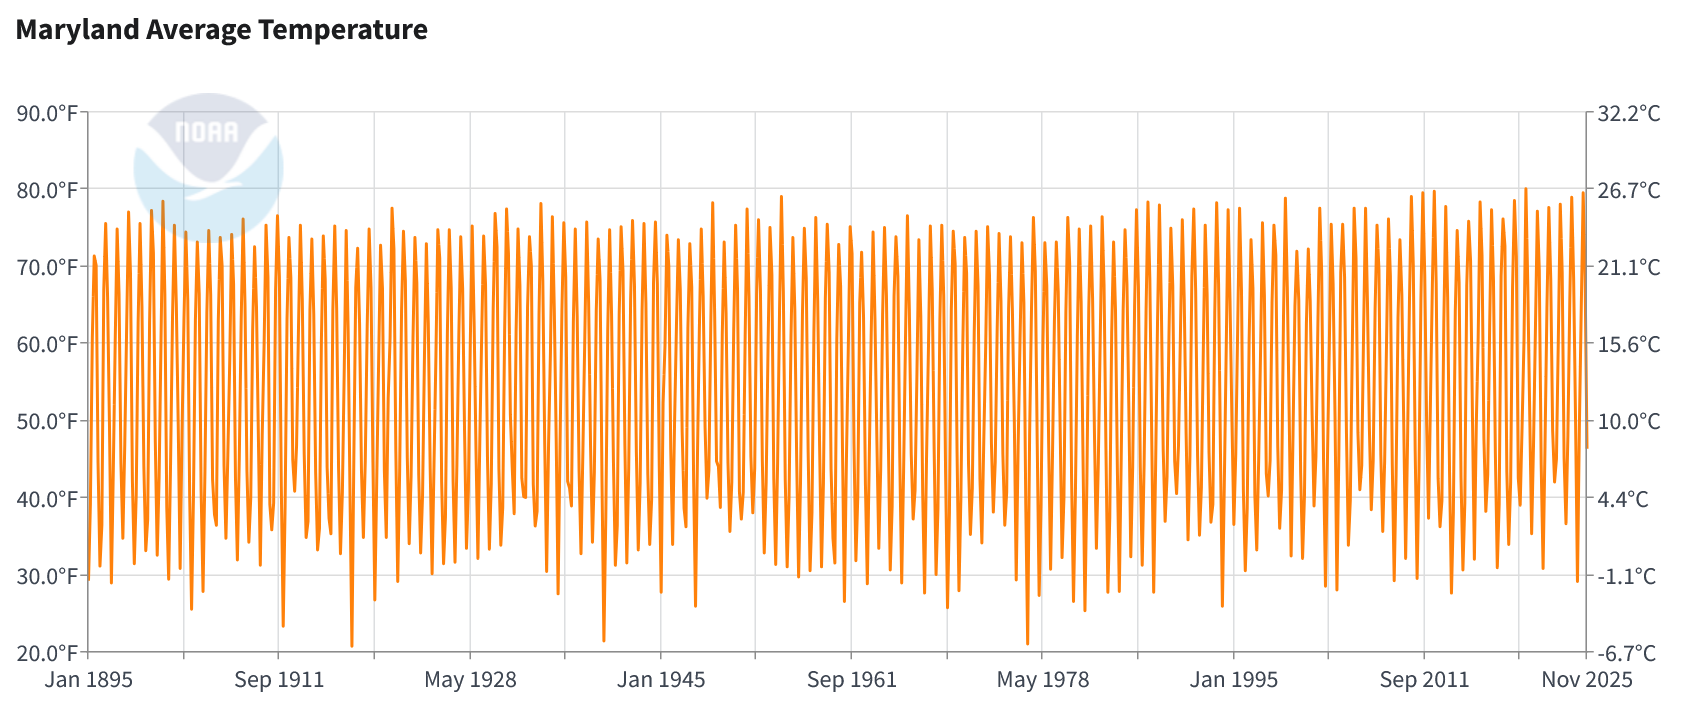
This is the monthly average temperature in Maryland from 1895 to 2025, plotted on the NOAA website linked above.
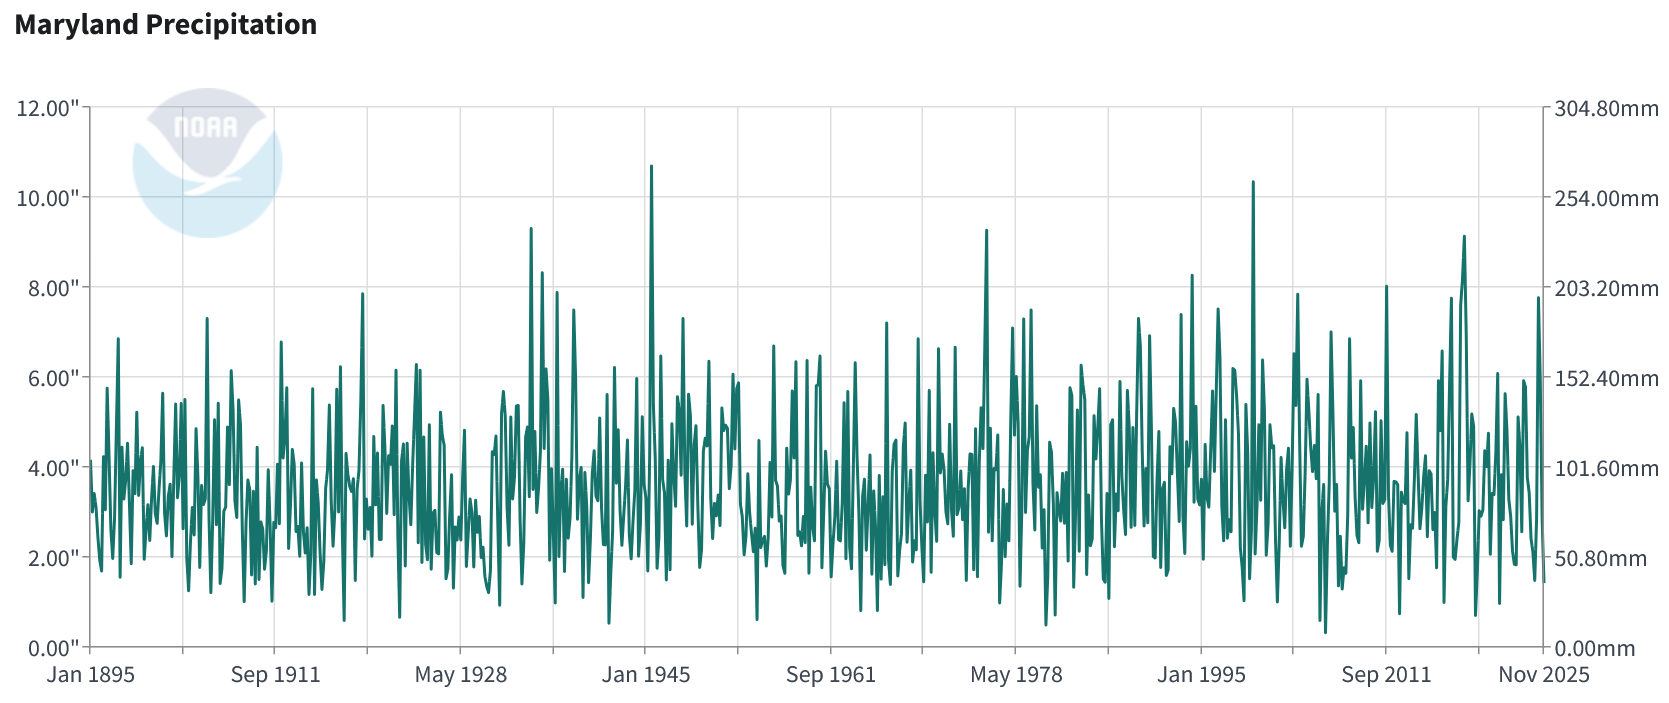
This is the monthly precipitation in inches in Maryland from 1895 to 2025, plotted on the NOAA website linked above.
In order to build a climatology, I want to think about that typical weather— what is the temperature and amount of rain in a typical month? So I replot the same data, now with the horizontal axis being the twelve months, rather than all time. This way, the values from the 130 years all go on top of each other and show the spread.
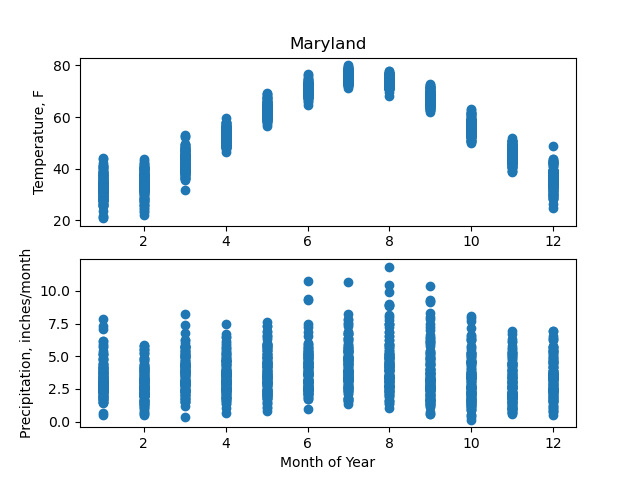
The top plot shows the mean temperature (in degrees Fahrenheit) for each month. Months are on the horizontal axis, temperature on the vertical axis, and each data point is a blue dot.
The bottom plot is similar, but for the precipitation, in inches of rain per month. Snow is converted into the equivalent rain rate.
Now that the data has been visualized, what does it tell us about the climate of Maryland? There is a clear seasonal cycle in temperature, with July being the hottest most years and January and February the coldest. On the other hand, the precipitation is about the same in every month— there is more change in the rain in a given month from year to year than there is between the months.
Next, I took the average (mean) in each month of these data, and overlaid it on the same plot.
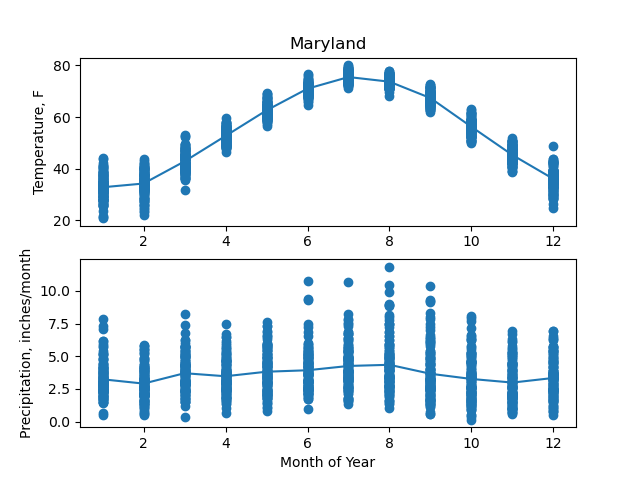
The same figure, now with a line overlaid on each plot. This blue line is the mean (average) in each month of the values from all the years 1895-2025.
So, now that we know some information about the climate of Maryland, how do we contextualize that? One way to categorize climates is the Koppen classification. This system characterizes the climate of any place on Earth using a two- or three-letter code. The letters are assigned based on the characteristics of the monthly (seasonal) pattern of temperatures and precipitation. An example of those assigned categories for the US is below:
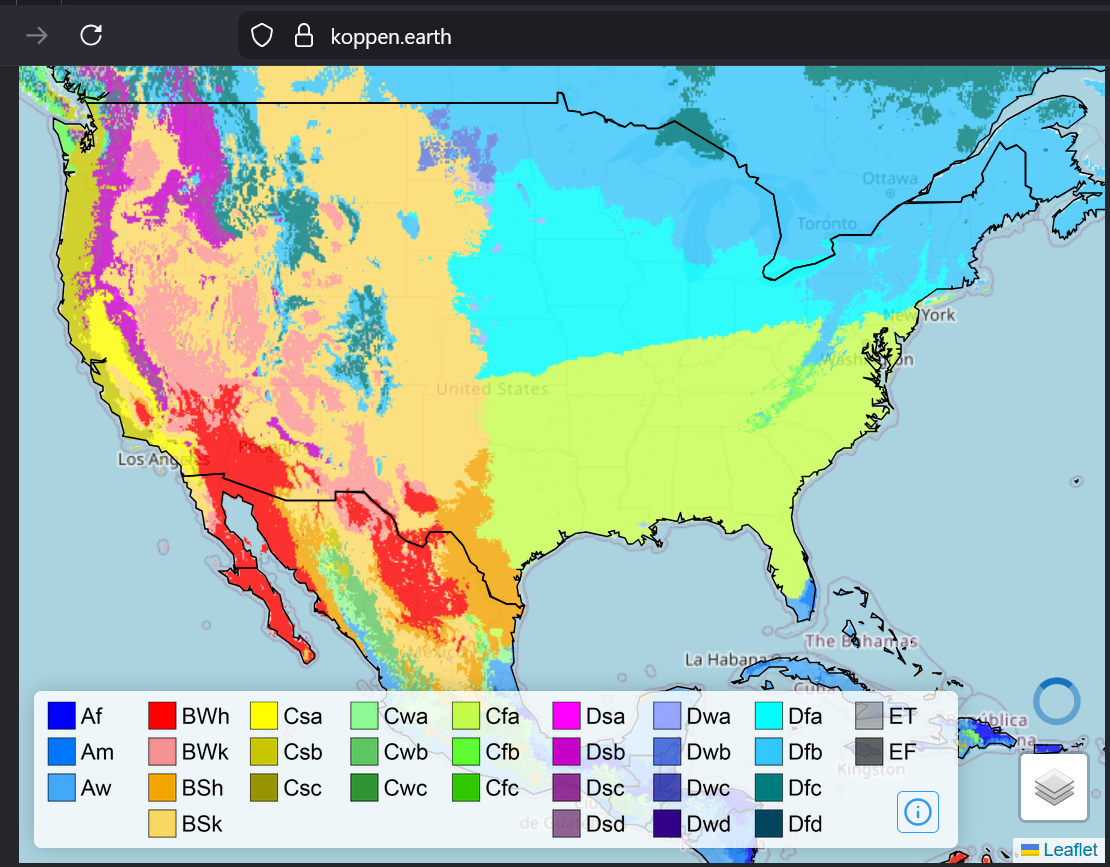
This map, centered on USA, shows the Koppen classifications. There is a color for each two or three letter code. This image is from koppen.earth
According to the map, Maryland falls in the Cfa category. Let’s check that, based on the data above. C means a temperature climate, which is required to have the coldest month averaging between 32 °F and 64.4 °F and at least one month averaging above 50 °F. We do have the coldest month averaging below 40 °F and the hottest above 60 °F, so the C fits.
Cfa means humid subtropical climate: coldest month averaging above 32 °F, at least one month's average temperature above 71.6 °F, and at least four months averaging above 50 °F. No significant precipitation difference between seasons. The second I can agree with immediately— the precipitation is fairly steady. For the temperatures, yes, the coldest month is above freezing on average (not every year, but that’s not the requirement). Yes, July is above 72. The months above 50 on average are May to October. So yes, this is the right category.
To summarize: here I built a climatology of the weather in Maryland from 130 years of data, identified the seasonal pattern of temperature (strong) and precipitation (no significant changes across the months), and then categorized that climate as Koppen classification Cfa, a humid subtropical climate.